Over the years, I’ve worked with a wide range of clients— from a CRM SaaS company to 20 schools and 5 colleges—and one thing has remained constant: everyone wants clarity on results. The best way to provide that clarity is through monthly marketing reports.
A well-structured report doesn’t just showcase numbers; it tells a story of what’s working, what’s not, and what actions we should take next. But the truth is, many marketers either overcomplicate reports with vanity metrics or underdeliver by missing what actually matters to decision-makers.
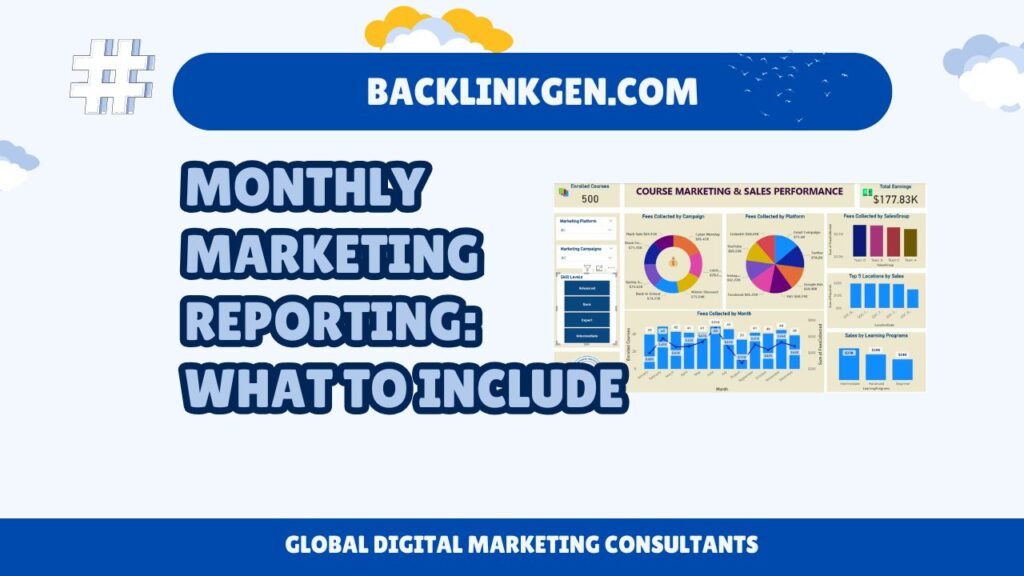
In this blog, I’ll walk you through the key elements of a monthly marketing report, drawn from my 15+ years of experience in digital marketing.
1. Executive Summary
Every great report starts with a high-level overview. This section should highlight key wins, areas of concern, and next steps.
For example, in a school campaign, I summarize:
- “Facebook ads drove 40% more inquiries this month.”
- “Google Ads leads were high-quality, but cost per lead increased by 15%.”
- “We recommend adjusting targeting and testing new creatives.”
👉 Busy stakeholders don’t have time to read every chart—give them the headlines upfront.
2. Traffic Overview
This section answers: How many people came to the website, and from where?
Break traffic into channels:
- Organic Search
- Paid Search (Google Ads)
- Social Media (Facebook, Instagram, X, LinkedIn, Threads)
- Referral
- Direct
In one of my SaaS accounts, this analysis showed organic traffic was climbing, but direct traffic was flat. That told us we were improving SEO visibility but needed stronger brand awareness campaigns.
3. Lead & Conversion Metrics
Traffic means little without conversions. This section shows how many visitors became leads or customers.
Key metrics to include:
- Total Conversions (sign-ups, applications, purchases).
- Conversion Rate (percentage of visitors who converted).
- Cost per Conversion/Lead (CPL).
👉 For colleges, I track inquiries → applications → admissions. This funnel view makes it easier for them to see how marketing directly supports enrollment goals.
4. Paid Media Performance
If you’re running paid ads (Google Ads, Meta Ads, etc.), dedicate a section to campaign performance.
Include:
- Spend vs. Budget.
- Impressions, Clicks, CTR (Click-Through Rate).
- Cost per Click (CPC).
- Cost per Lead (CPL).
- Return on Ad Spend (ROAS).
For example, in one of my school campaigns, reporting showed Google Ads CPL was $20 while Facebook Ads CPL was $12. This allowed us to shift budget for higher efficiency without guessing.
5. SEO Performance
SEO takes time, so stakeholders want to see progress each month. Include:
- Keyword Rankings (top gains/losses).
- Organic Traffic Trends.
- Backlink Growth.
- Technical SEO Updates (site speed, mobile optimization).
👉 For the SaaS company, a monthly ranking report helps them understand that while leads may not spike overnight, their presence in top-of-funnel searches is expanding steadily.
6. Social Media Performance
Social isn’t just about vanity metrics. Focus on engagement and leads.
Key metrics:
- Follower Growth.
- Engagement Rate (likes, comments, shares per follower).
- Website Traffic from Social.
- Conversions Assisted by Social.
For colleges, I often show how social ads contributed to early engagement, even if the last click came from Google Search. This builds trust in the importance of brand-building campaigns.
7. Email Marketing Performance
If email campaigns are part of the strategy, include:
- Open Rate.
- Click-Through Rate.
- Unsubscribe Rate.
- Conversions from Email.
For example, when we tested different subject lines for a SaaS onboarding campaign, the report showed a 15% lift in open rates—a clear win we could replicate.
8. Content Performance
Content fuels SEO, social, and even paid campaigns. Report on:
- Top Blog Posts (by traffic & conversions).
- Engagement Metrics (time on page, bounce rate).
- Leads Generated from Content Offers (e.g., whitepapers, case studies).
👉 At one school, a blog on “How to Choose the Right School in [City]” became the highest organic traffic driver. Including this in reports helped justify more investment in local content.
9. ROI & Business Impact
This is where the data meets the bottom line. Show how marketing is impacting revenue or key business outcomes.
Metrics to include:
- Return on Ad Spend (ROAS).
- Cost per Acquisition (CPA).
- Lifetime Value (LTV).
- Pipeline Influence (for SaaS/CRM clients).
For educational clients, I tie campaigns directly to admissions revenue—because at the end of the day, that’s what matters most to leadership.
10. Recommendations & Next Steps
Numbers alone aren’t enough. Your report should always end with actionable recommendations.
Examples I include:
- “Shift 20% of Facebook ad spend to Instagram where CPL is lower.”
- “Create content around ‘Top 10 CRM Features’ as it’s trending in search.”
- “Run A/B testing on landing page CTAs to improve conversion rate.”
👉 Without this section, reports become passive. With it, they become a roadmap for smarter marketing.
Final Thoughts
A monthly marketing report isn’t just about showcasing effort—it’s about demonstrating value. When done right, it aligns marketing activities with business goals, builds trust with stakeholders, and helps you make smarter decisions for the next month.
For me, reporting is not a “tick-the-box” task. It’s a chance to have a meaningful conversation with clients—whether it’s the SaaS team I work with or the schools and colleges I manage—about how we’re moving the needle.
If you want your reports to stand out, focus on clarity, context, and action. Numbers tell a story—make sure yours is one that drives results.
✨ Amit’s Tip: Don’t overwhelm clients with 50 charts. Keep your report visual, relevant, and actionable. Decision-makers will thank you for clarity over clutter.