Website speed is no longer just a technical concern for developers. It directly affects user experience, conversions, search visibility, and the overall performance of a business website.
For marketers, SEO professionals, business owners, and developers, one of the most useful free tools for understanding website performance is Google PageSpeed Insights.
In my experience working on SEO, website development, WordPress, analytics, and digital marketing projects, I have found that businesses often make one common mistake: they treat the PageSpeed score as the goal.
It is not.
A score of 100 is not necessarily required for a successful website. What matters more is understanding why a website is slow, which metrics are actually affecting users, and which improvements can produce meaningful business results.
This guide explains what Google PageSpeed Insights is, how to use it, what its major metrics mean, how to interpret the report, and how businesses should prioritize performance improvements.
What Is Google PageSpeed Insights?
Google PageSpeed Insights, commonly called PSI, is a free Google tool that analyzes the performance of a web page on both mobile and desktop devices.
You can access it here:
You enter a webpage URL, and PageSpeed Insights generates a performance report containing:
- Performance scores
- Core Web Vitals
- Loading metrics
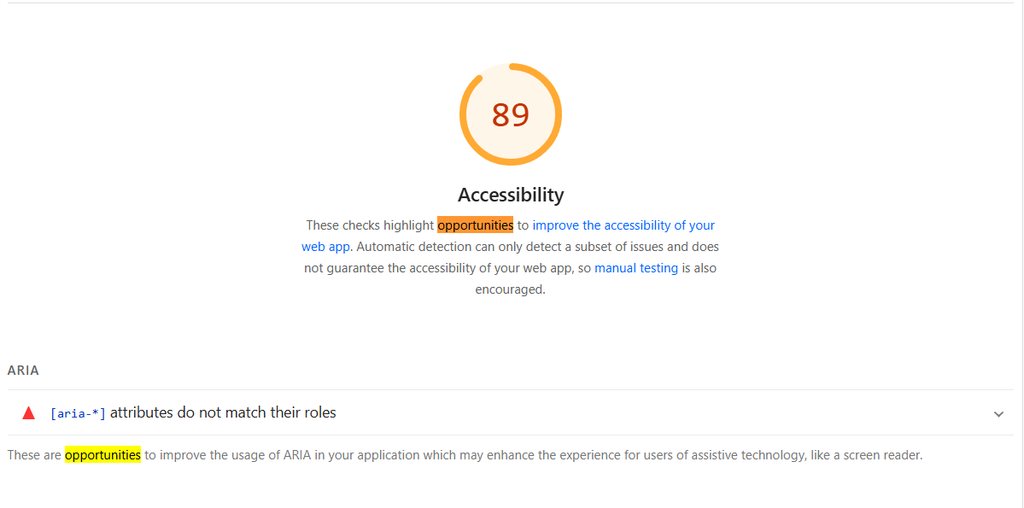
- Accessibility information
- SEO checks
- Best practices
- Opportunities for improvement
- Diagnostics
- Field data when available
One important point is that PageSpeed Insights is not simply a “website speed checker.”
It combines different types of information to help you understand both real-user performance and laboratory performance.
This distinction is extremely important when analyzing a business website.
Why PageSpeed Insights Matters for SEO and Digital Marketing
Website performance affects the experience users have after clicking your search result, advertisement, social media post, email campaign, or referral link.
Imagine that you spend thousands of dollars on Google Ads and SEO but send visitors to a page that takes too long to become usable.
You may generate traffic, but poor performance can contribute to:
- Higher abandonment
- Lower engagement
- Poorer conversion rates
- Frustrating mobile experiences
- Lower-quality user experience
Google also uses Core Web Vitals as part of its page experience considerations.
However, I would strongly recommend avoiding the mindset that “PageSpeed score equals SEO ranking.”
SEO is much broader.
Content quality, search intent, relevance, authority, technical SEO, internal linking, backlinks, structured data, website architecture, and many other factors remain important.
PageSpeed should therefore be treated as one component of a broader SEO and conversion strategy.
How to Use Google PageSpeed Insights
Using PageSpeed Insights is straightforward.
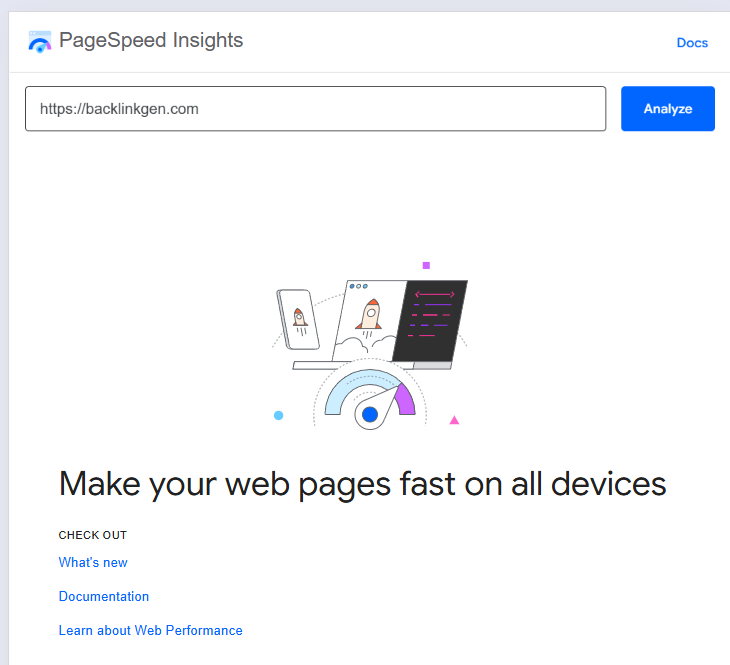
Step 1: Open PageSpeed Insights
Visit:
You will see a field where you can enter the URL of the webpage you want to analyze.
Step 2: Enter the Exact URL
Enter the page you want to test.
For example, if you want to analyze your homepage, enter the homepage URL.
If you want to analyze a service page, enter the specific service page.
This is important because PageSpeed Insights analyzes the specific URL, not simply the entire domain.
A website may have a fast homepage but a slow product page.
Similarly, one blog article may perform very well while another page has excessive scripts, large images, or complicated layouts.
Step 3: Run the Analysis
Click Analyze.
PageSpeed Insights will generate a report.
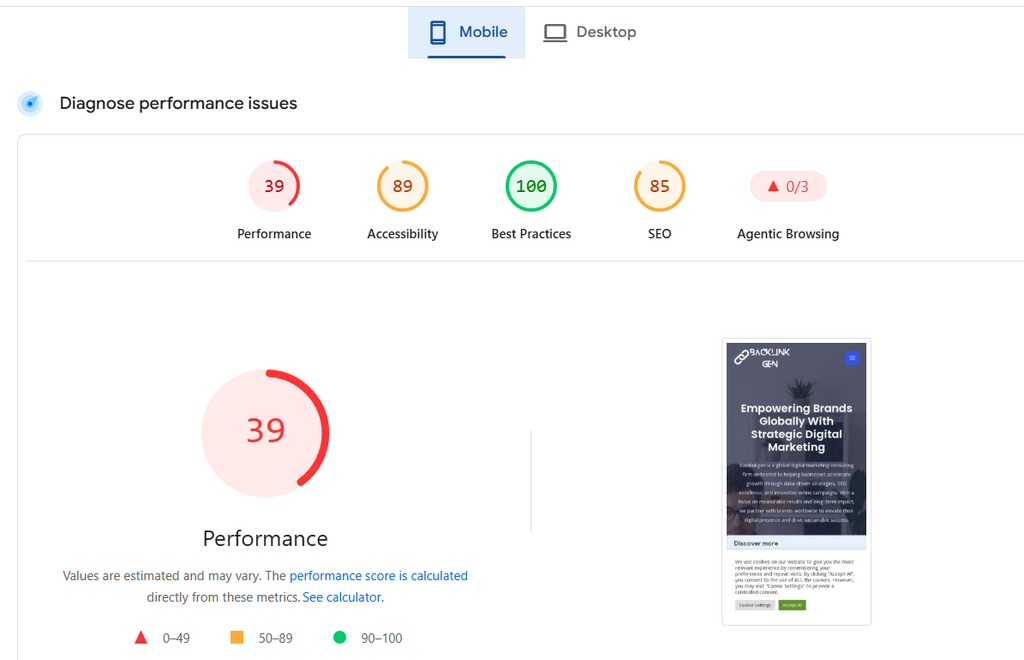
You can normally switch between:
- Mobile
- Desktop
I recommend checking both.
However, for many businesses, I would give particular attention to the mobile experience, because a significant percentage of website traffic can come from mobile devices.
Understanding the PageSpeed Insights Performance Score
The Performance score is one of the first things people notice.
The score is presented on a scale from 0 to 100.
Generally:
- 90–100: Good
- 50–89: Needs improvement
- 0–49: Poor
But don’t stop your analysis here.
A performance score is a summary generated from several performance metrics. It is useful as a high-level indicator, but it does not tell you everything about how visitors experience the website.
For example, two websites could have similar scores but completely different technical problems.
One may have a large JavaScript payload.
Another may have poor image optimization.
Another may experience slow server response time.
Therefore, I recommend using the score as a starting point rather than the final objective.
Lab Data vs Field Data
One of the most important concepts when using PageSpeed Insights is understanding the difference between lab data and field data.
What Is Lab Data?
Lab data is generated under controlled testing conditions.
It is useful for diagnosing problems and testing technical changes.
It can help identify issues such as:
- Render-blocking resources
- Large images
- Excessive JavaScript
- CSS problems
- Long main-thread activity
- Unused resources
Lab data is particularly useful during development and optimization.
What Is Field Data?
Field data represents measurements collected from real users when sufficient data is available.
This can give you a much more realistic understanding of how actual visitors experience the page.
Real users have different:
- Devices
- Internet connections
- Locations
- Browsers
- Hardware capabilities
Therefore, field data and lab data may not always match.
This is completely normal.
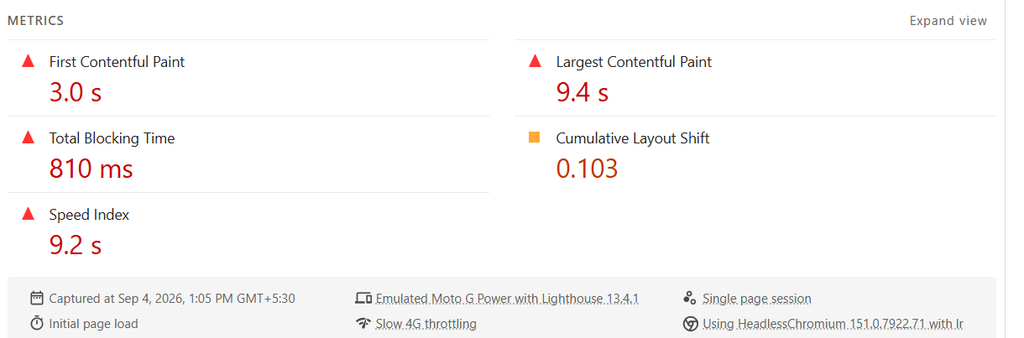
What Are Core Web Vitals?
Core Web Vitals are a group of user-experience metrics used to evaluate important aspects of webpage performance.
The three major Core Web Vitals are:
- Largest Contentful Paint
- Interaction to Next Paint
- Cumulative Layout Shift
Let’s understand each one.
Largest Contentful Paint
Largest Contentful Paint, or LCP, measures how quickly the largest visible content element becomes rendered.
It commonly represents a major element such as:
- Hero image
- Large heading
- Banner
- Main content block
A good LCP is generally 2.5 seconds or less.
Between 2.5 and 4 seconds needs improvement, while above 4 seconds is considered poor.
For example, imagine a website’s homepage contains a large hero image.
If that image is extremely large and takes several seconds to load, the visitor may see an incomplete page while waiting.
Common Causes of Poor LCP
Some common causes include:
- Large hero images
- Slow server response
- Render-blocking CSS
- Poor image delivery
- Excessive JavaScript
- Web font delays
- Slow hosting infrastructure
For WordPress websites, I frequently investigate the hero image, theme resources, plugins, caching configuration, and third-party scripts when LCP is poor.
Interaction to Next Paint
Interaction to Next Paint, or INP, measures how responsive a page is to user interactions.
It replaced First Input Delay as a Core Web Vital.
INP considers interactions such as:
- Clicking buttons
- Opening menus
- Selecting options
- Entering information
- Interacting with page elements
A good INP is generally 200 milliseconds or less.
Between 200 and 500 milliseconds needs improvement, while above 500 milliseconds is poor.
A website can therefore load quickly but still feel slow.
For example, the page may visually appear ready, but when the user clicks a button, JavaScript may keep the browser busy.
That creates a frustrating experience.
Common Causes of Poor INP
Typical causes include:
- Heavy JavaScript
- Long-running scripts
- Excessive third-party scripts
- Large JavaScript frameworks
- Poor event handling
- Excessive DOM complexity
This is why simply improving image compression will not necessarily solve every PageSpeed problem.
Cumulative Layout Shift
Cumulative Layout Shift, or CLS, measures visual instability.
Have you ever tried to click a button on a website, only for the page to move and cause you to click something else?
That is a layout-shift problem.
A good CLS is generally 0.1 or less.
Common causes include:
- Images without defined dimensions
- Dynamically injected content
- Advertising elements
- Late-loading fonts
- Elements changing size during loading
For example, if a banner suddenly appears above a button after the page starts loading, everything below it can shift downward.
This creates a poor user experience.
Other Important PageSpeed Metrics
Core Web Vitals are not the only metrics worth understanding.
First Contentful Paint
First Contentful Paint, or FCP, measures when the browser renders the first piece of visible content.
This helps indicate when the user first sees something meaningful on the page.
A faster FCP generally creates a perception that the page is beginning to load quickly.
Speed Index
Speed Index measures how quickly visible content is populated during loading.
It is primarily a lab metric and can help identify pages that visually load slowly.
Total Blocking Time
Total Blocking Time, or TBT, measures how much time the main thread is blocked during page loading in laboratory testing.
It can be particularly useful when investigating JavaScript-heavy websites.
High TBT can indicate that the browser is spending too much time processing scripts.
Time to First Byte
Time to First Byte, or TTFB, measures how quickly the browser receives the first byte of data from the server.
A poor TTFB can indicate problems involving:
- Hosting
- Server configuration
- Database queries
- Backend processing
- CDN configuration
- Network latency
If the server is slow, optimizing front-end assets alone may not solve the underlying problem.
How to Read Opportunities in PageSpeed Insights
After reviewing the metrics, scroll down to the Opportunities section.
This is where PageSpeed Insights can become particularly useful for developers and SEO professionals.
You may see recommendations such as:
- Serve images in next-generation formats
- Properly size images
- Eliminate render-blocking resources
- Reduce unused JavaScript
- Reduce unused CSS
- Minify CSS
- Minify JavaScript
- Enable text compression
- Preload key requests
- Reduce initial server response time
Each recommendation should be evaluated based on the actual website.
Don’t blindly implement every recommendation.
For example, removing a JavaScript file may improve a laboratory score but break an important website feature.
Performance optimization should therefore always be approached as a controlled technical process.
How I Approach PageSpeed Optimization
When I audit a website, I don’t start by chasing a 100/100 score.
I start by asking:
What is actually making this website slow for users?
My typical approach is:
1. Check Real-User Data
If field data is available, I first examine the actual Core Web Vitals.
This provides valuable evidence about the real user experience.
2. Identify the Biggest Bottleneck
I determine whether the primary problem is:
- Server response
- Images
- CSS
- JavaScript
- Fonts
- Third-party scripts
- Layout instability
3. Prioritize Business-Critical Pages
I don’t necessarily optimize every page equally.
For a business website, I would prioritize:
- Homepage
- Main service pages
- Product pages
- Landing pages
- High-traffic blog pages
- Conversion pages
A slow page receiving 50,000 monthly visitors deserves more attention than an internal page receiving almost no traffic.
4. Optimize Images
Images are frequently responsible for unnecessary page weight.
I look at:
- Image dimensions
- Compression
- Modern formats
- Responsive images
- Lazy loading
- Image delivery
- Hero image prioritization
However, important above-the-fold images should not automatically be lazy-loaded.
5. Review JavaScript
Modern websites can load a large amount of JavaScript.
I investigate:
- Unused JavaScript
- Plugin scripts
- Tracking scripts
- Chat widgets
- Advertising scripts
- Social integrations
- Unnecessary libraries
Third-party scripts deserve special attention because you may have limited control over how they behave.
6. Review CSS
Large CSS files and render-blocking styles can delay visual rendering.
I look for opportunities to:
- Remove unused CSS
- Minify CSS
- Defer non-critical resources
- Optimize critical rendering
7. Review Hosting and Server Response
If TTFB is consistently poor, I investigate the infrastructure.
Front-end optimization cannot compensate indefinitely for an underperforming server.
8. Test Again
After making changes, run another test.
More importantly, compare the result with the previous state.
Performance optimization should be measurable.
PageSpeed Insights and WordPress
WordPress websites require a slightly different approach.
A WordPress website can accumulate performance issues from:
- Themes
- Plugins
- Page builders
- Tracking tools
- WooCommerce
- Fonts
- Images
- External APIs
- Marketing scripts
This does not mean WordPress is inherently slow.
A properly configured WordPress website can perform very well.
The important question is what has been added to the website and how those components are being loaded.
For example, installing multiple optimization plugins without understanding how they interact can sometimes create new problems instead of solving existing ones.
My recommendation is to establish a baseline first, make controlled changes, and test after each significant optimization.
Common PageSpeed Mistakes Businesses Make
Chasing 100 Instead of User Experience
A perfect score is not the purpose of performance optimization.
Focus on meaningful improvements.
Testing Only the Homepage
Your homepage is only one URL.
Always test important landing pages and high-traffic pages.
Testing Only on Desktop
Desktop performance can look excellent while mobile performance is poor.
Always review both.
Optimizing Without Measuring
Don’t make ten changes simultaneously and then wonder which one helped.
Where possible, make changes systematically.
Ignoring Third-Party Scripts
Analytics, chat, advertising, social media, heatmaps, and other integrations can affect performance.
Every script should justify its cost.
PageSpeed Score vs Core Web Vitals
These are related but not identical.
The PageSpeed Performance score is a laboratory score calculated from several performance signals.
Core Web Vitals focus specifically on important real-world user experience measurements.
Therefore, don’t assume:
High PageSpeed score = perfect website
or:
Low PageSpeed score = poor SEO
The correct approach is to understand the underlying metrics and determine which problems actually matter.
How Often Should You Check PageSpeed Insights?
There isn’t a universal requirement to run PageSpeed Insights every day.
I recommend testing when:
- A new website is launched
- A major redesign is completed
- A new theme is installed
- Plugins are added
- Major tracking tools are implemented
- Landing pages are created
- Performance suddenly declines
- Core Web Vitals deteriorate
- Hosting infrastructure changes
For active websites, performance should be part of an ongoing technical SEO process rather than a one-time activity.
What Is Google PageSpeed Insights?
Google PageSpeed Insights is a free Google tool that analyzes webpage performance on mobile and desktop. It reports performance metrics, Core Web Vitals, opportunities, diagnostics, accessibility, SEO checks, and other technical information to help website owners identify performance and user-experience problems.
Is a 100 PageSpeed score necessary?
No. A 100 PageSpeed score is not necessary for a successful website. Businesses should prioritize real-user experience, Core Web Vitals, conversion performance, technical stability, and important page-level issues instead of optimizing solely to achieve a perfect laboratory score.
What are the three Core Web Vitals?
The three Core Web Vitals are Largest Contentful Paint, Interaction to Next Paint, and Cumulative Layout Shift. They measure important aspects of user experience including loading performance, responsiveness, and visual stability.
What is a good LCP score?
A good Largest Contentful Paint score is generally 2.5 seconds or less. A result between 2.5 and 4 seconds needs improvement, while a result above 4 seconds is considered poor.
What is a good INP score?
A good Interaction to Next Paint score is 200 milliseconds or less. Between 200 and 500 milliseconds needs improvement, while an INP above 500 milliseconds is considered poor.
What is a good CLS score?
A good Cumulative Layout Shift score is 0.1 or less. A score between 0.1 and 0.25 needs improvement, while a score above 0.25 is considered poor.
Does PageSpeed Insights affect Google rankings?
PageSpeed Insights itself does not directly provide a ranking score. Google uses various signals, including Core Web Vitals as part of its page experience systems. Website owners should therefore improve performance as part of a broader SEO and user-experience strategy rather than treating the PageSpeed score as a direct ranking formula.
Why is my website fast on my computer but slow on PageSpeed Insights?
Your computer may have a faster processor, better internet connection, cached resources, and different network conditions than the testing environment. PageSpeed Insights also provides laboratory testing under controlled conditions, while field data reflects real users. Differences between your personal experience and PSI results are therefore possible.
How can I improve my Google PageSpeed score?
Start by identifying the largest performance bottlenecks. Common improvements include optimizing images, reducing unnecessary JavaScript and CSS, improving server response time, eliminating render-blocking resources, optimizing fonts, reducing third-party scripts, and improving caching and content delivery.
Conclusion
Google PageSpeed Insights is one of the most useful free tools available for understanding website performance, but it should be used intelligently.
The biggest mistake I see is businesses treating the PageSpeed number as the objective.
The objective should be a faster, more responsive, stable, and conversion-friendly website.
Start with the important pages. Check both mobile and desktop. Understand the difference between laboratory and real-user data. Pay particular attention to Core Web Vitals, especially LCP, INP, and CLS.
Then investigate the actual causes behind poor performance.
For SEO professionals, PageSpeed Insights can become much more powerful when combined with Google Search Console, GA4, server-side analysis, crawling tools, and conversion data.
A website with a technically impressive score but poor content and poor conversion experience is not necessarily a successful website.
On the other hand, a website that loads efficiently, provides a stable and responsive experience, satisfies search intent, and converts visitors into customers is much closer to what businesses should actually be building.
My recommendation is simple: don’t optimize your website for a number. Optimize it for the people using it—and use PageSpeed Insights to understand where the technical improvements can make the biggest difference.
Disclaimer: PageSpeed Insights results can vary based on testing conditions, device, network, server response, and real-user data availability. Performance recommendations should be evaluated before implementation, especially on production websites.
About Author:
Amit Tyagi is a Senior Digital Marketing Specialist and Web Development Strategist with over 15 years of experience in SEO, website development, and data-driven digital growth. He has successfully built and optimized more than 50 websites across various industries, helping businesses improve online visibility, generate leads, and increase revenue through strategic digital marketing.
His expertise spans search engine optimization (SEO), content strategy, conversion-focused web development, marketing automation, and analytics-driven decision making. Amit combines technical development skills with advanced digital marketing strategies to create high-performing digital ecosystems for brands.
Throughout his career, Amit has worked on eCommerce, B2B platforms, and enterprise-level digital projects, delivering scalable solutions that align technology with business goals. He is also known for sharing insights on modern SEO trends, AI-driven marketing, and future digital strategies.
Amit believes that the future of marketing lies at the intersection of technology, data, and strategic storytelling.